Discover more from The Conscious Consumer
Charts to Chew On: The Tea on Q3.
Contextualizing monthly consumer sentiment and market momentum. Data as of October 29, 2023.
In an effort to keep pace with the all out sprint that seemingly always defines this time of year, I’ve elected to transition from monthly readouts to quarterly summaries on the state of the US consumer and what the associated economic implications might mean for the months ahead.
Digesting the geopolitical and economic uncertainty of the past few months, I’ve had a lot to chew on. While the alarming uptick in animosity we’ve witnessed at the global level has captivated headlines, there appears to be rising risks stateside for US consumers and companies alike.
While Q3 inked the S&P’s first quarterly loss since 2022, October to date has shown a sequential decline as GDP gains and resilient consumer spending pushed back the possibility of a rate cut. With the markets now pricing in >30% likelihood that rates move even higher by next summer, conversations surrounding borrowing costs are becoming increasingly grim. As both mortgage rates and subprime auto delinquency rates push past 2 decade highs, consumers are finding themselves in an increasingly precarious financial position. And as geopolitical developments risk driving inflation higher in critical consumer categories like energy, the built-in buffer of consumers’ COVID coffers appear to be wearing thin.
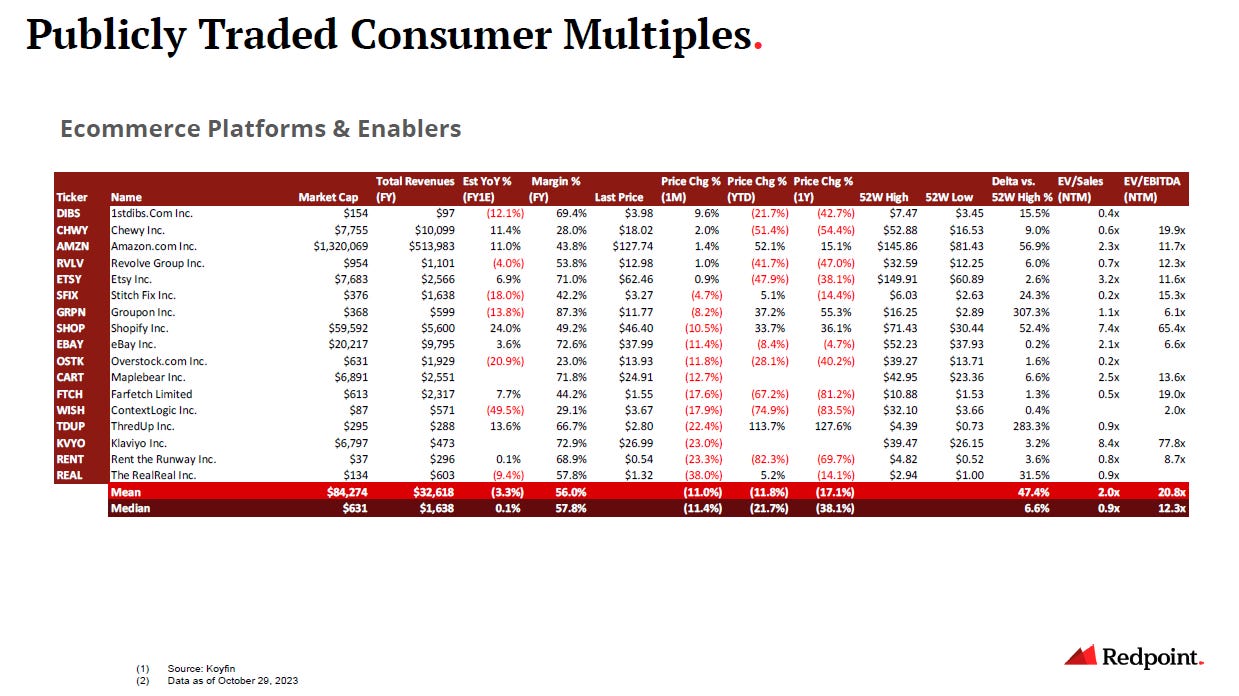
As we enter the final two months of the year, it is ostensibly anyone’s guess as to where the market heads from here. Yet, I hope that the charts below offer at least a bit of context as you similarly seek to make sense of the market mayhem around us…
As a big believer in kaizen, I’m always open to feedback. Whether it’s names to include or formats to explore, please help me help you! Subscribe to my Substack or find me on Twitter at @itsmeeraclark.


